Analysis of the recently published German insurance data
A dataset listing ICD-10 disease codes for all insurance claims filed by German doctors (outside of hospitals) for publicly insured Germans from 2016–1Q22 was recently published (more information). I’ll start with the obvious charts: chest pain, myocarditis and pericarditis increased by 19.3%, 53.1% and 26.9%, respectively, in 1Q22 compared to 1Q19.
[Note: An earlier version of this post did not include data from vaccine-injured patients (prefixed with “code” in the dataset). All charts and figures have been updated to include these values, and the trends described here are still apparent in the corrected figures.]
To calculate the absolute number of excess cases I fit a curve to values in the 2016–2019 period, using either a linear function or a quadratic curve if its R^2 explains at least half of the variance not explained by the linear function (at least R^2 + [1 - R^2]/2). To account for seasonality I adjusted every expected value by the average deviation from the curve in the corresponding quarters from 2016–2019. For example, excess deaths for myocarditis were calculated as follows:
Goodness of fit: linear = 0.286, quadratic = 0.291 => using linear
Avg deviation from trend (log_2 FC): Q1 = 0.121, Q2 = -0.0353, Q3 = -0.0974, Q4 = 0.0021
Correlation between adjusted curve and actual data: r = 0.804
1Q2021: expected = 40,749, actual = 37,360, excess = -3,389
2Q2021: expected = 36,850, actual = 40,000, excess = 3,150
3Q2021: expected = 35,557, actual = 49,119, excess = 13,562
4Q2021: expected = 38,376, actual = 51,316, excess = 12,940
1Q2022: expected = 41,961, actual = 59,186, excess = 17,225
Total excess since 1Q21: 43,487
And for chest pain:
Goodness of fit: linear = 0.115, quadratic = 0.124 => using linear
Avg deviation from trend (log_2 FC): Q1 = 0.175, Q2 = -0.0669, Q3 = -0.158, Q4 = 0.0278
Correlation between adjusted curve and actual data: r = 0.896
1Q2021: expected = 555,689, actual = 545,901, excess = -9,788
2Q2021: expected = 473,053, actual = 498,423, excess = 25,370
3Q2021: expected = 446,946, actual = 517,289, excess = 70,343
4Q2021: expected = 511,561, actual = 571,312, excess = 59,751
1Q2022: expected = 569,885, actual = 640,627, excess = 70,742
Total excess since 1Q21: 216,417
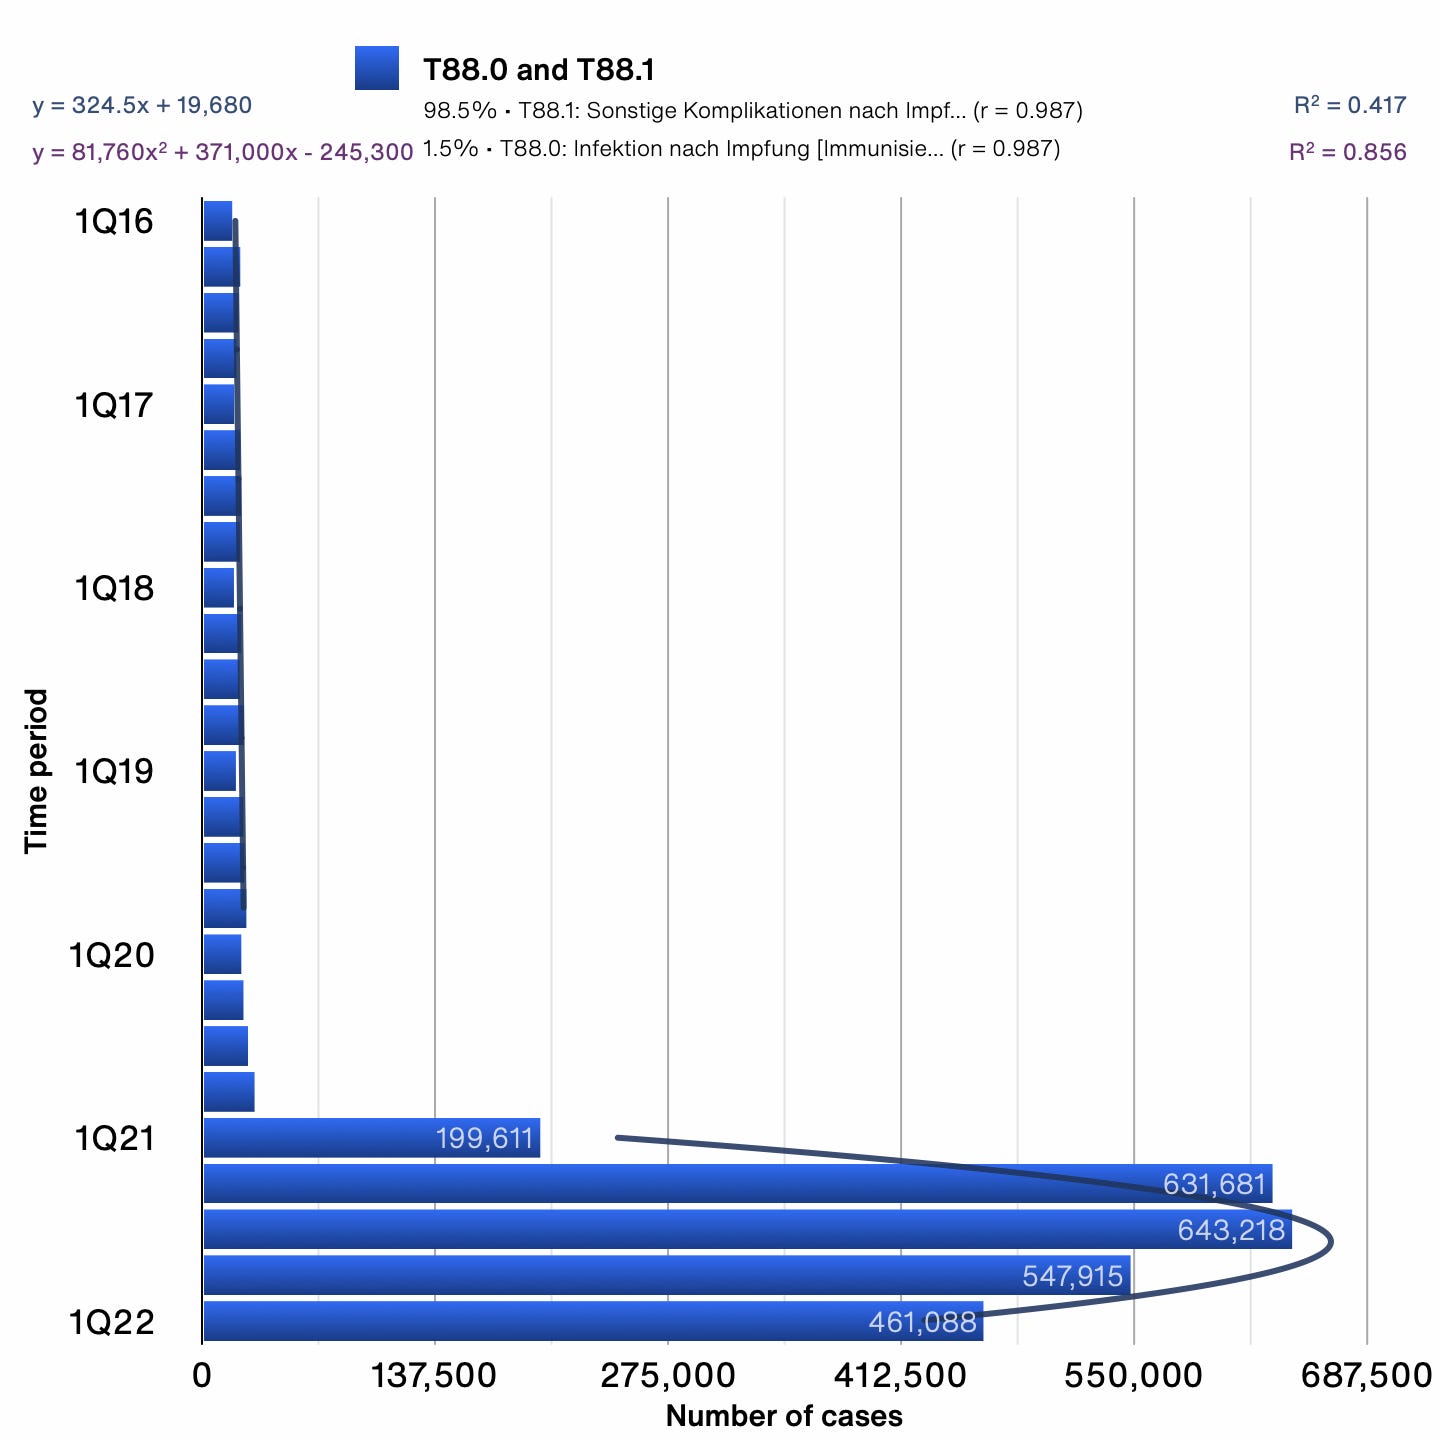
Using this method, there were an additional 43,487 myocarditis and 1,391 pericarditis cases, and around 216k excess cases of chest pain in the period from 1Q21–1Q22. Furthermore, there were 35,453 excess cases of sudden death and 2.4m excess cases of infections (T88.0) and other complications (T88.1) following immunization.
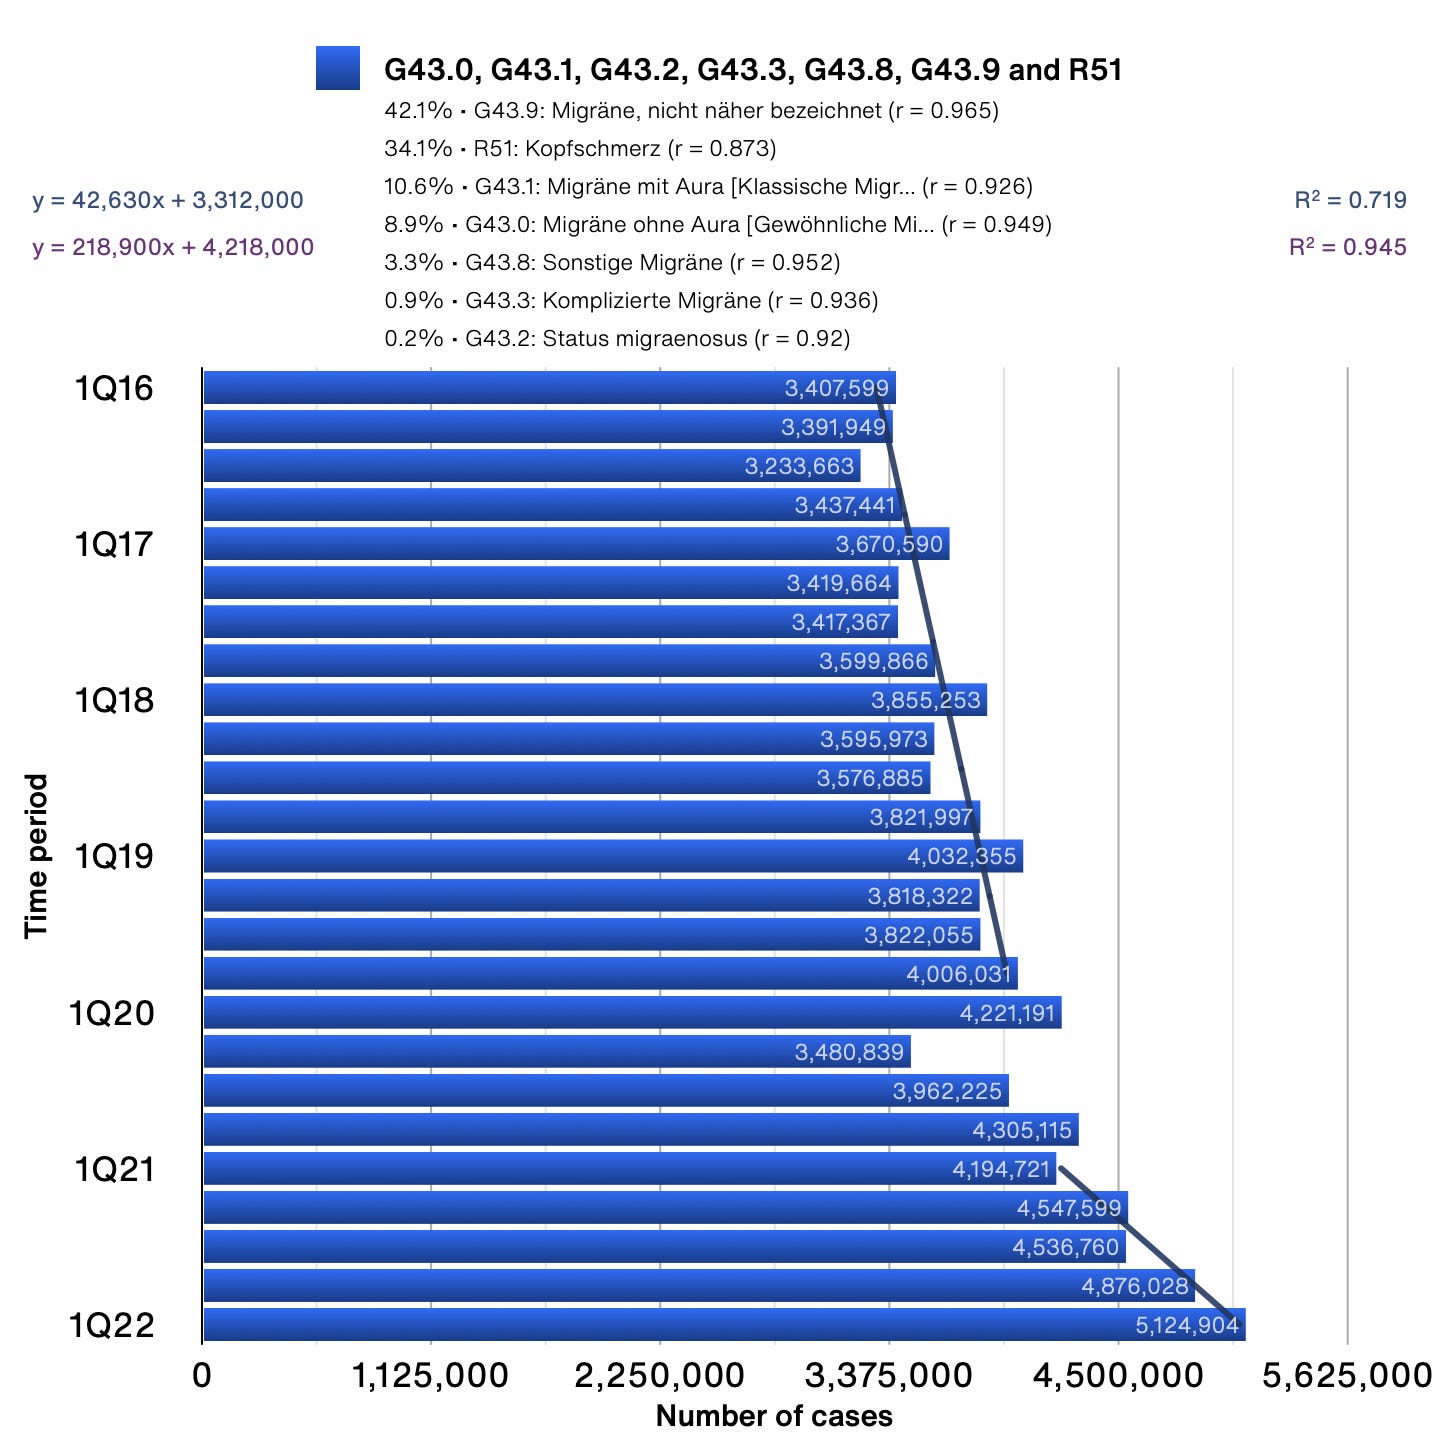
Another concerning signal is that a number of ordinary conditions such as headaches, respiratory infections and sore throats spiked unexpectedly in 1Q22.
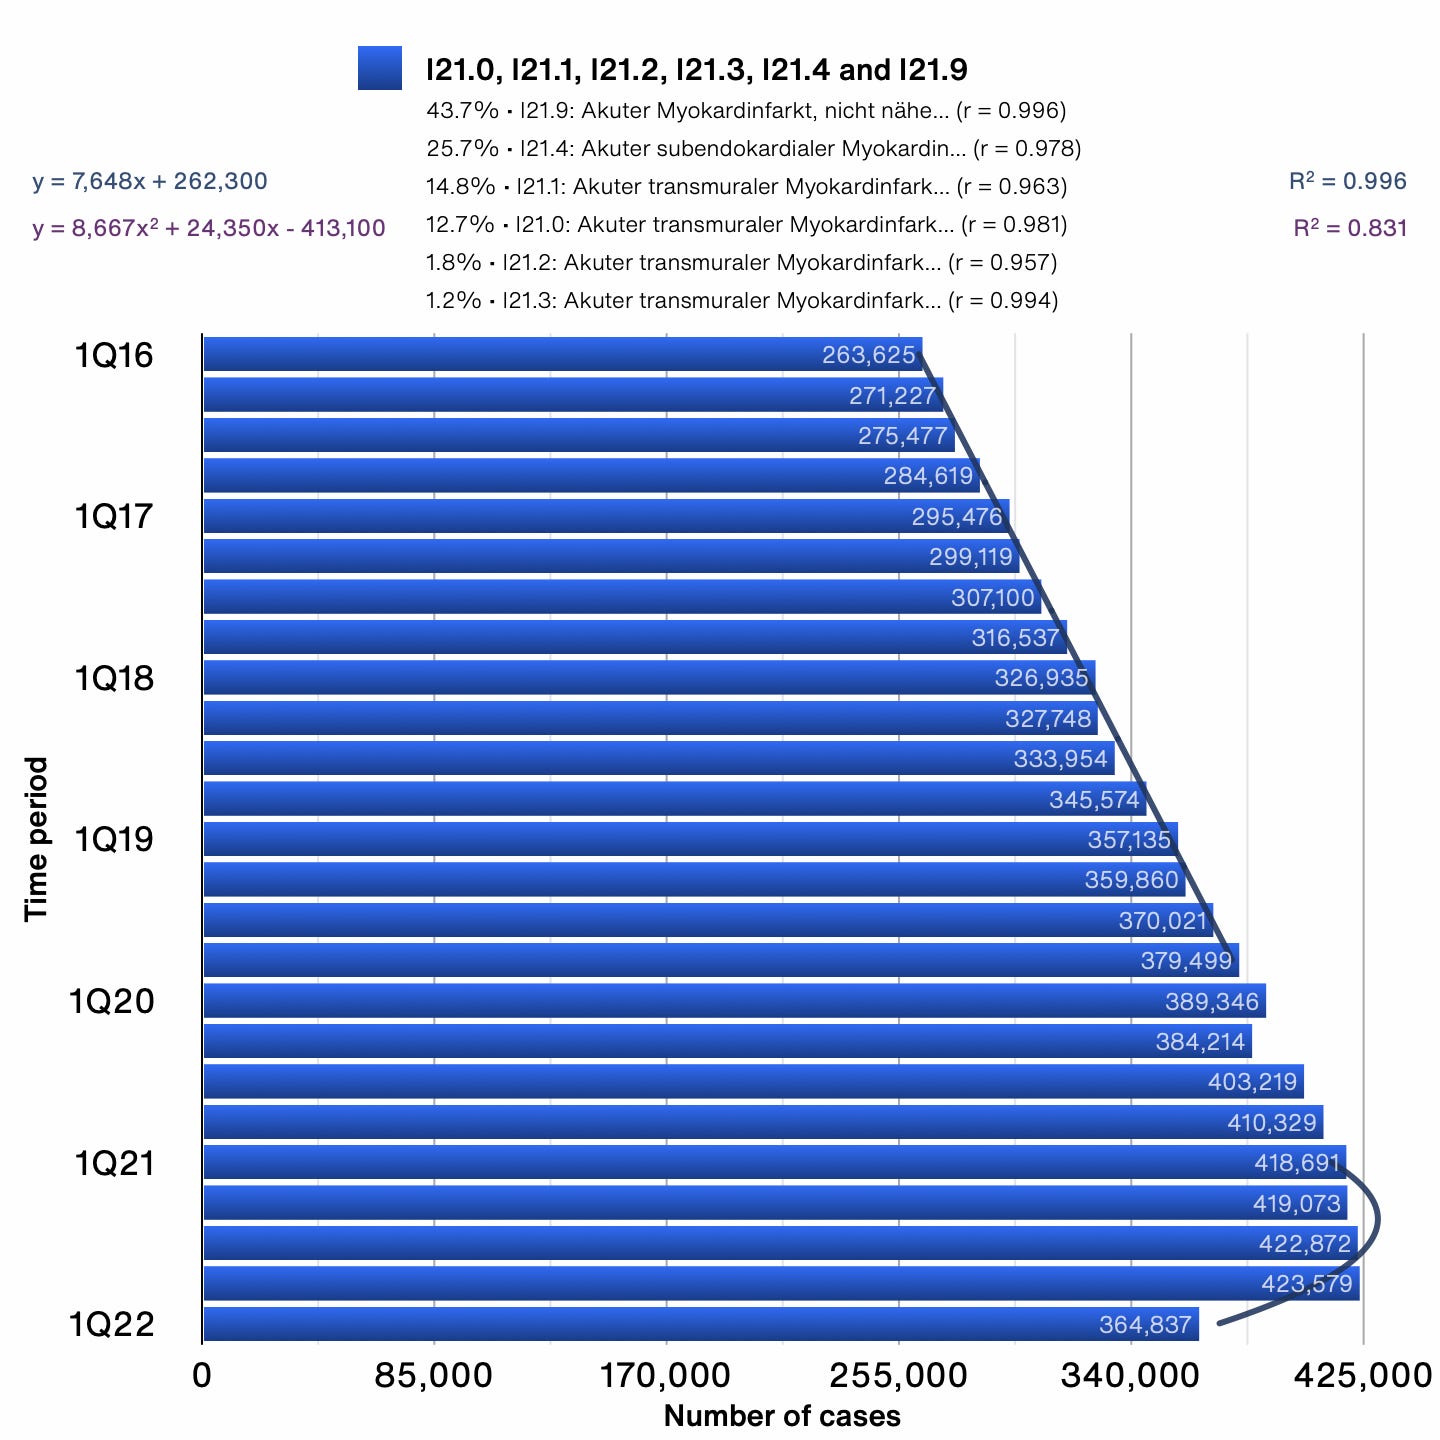
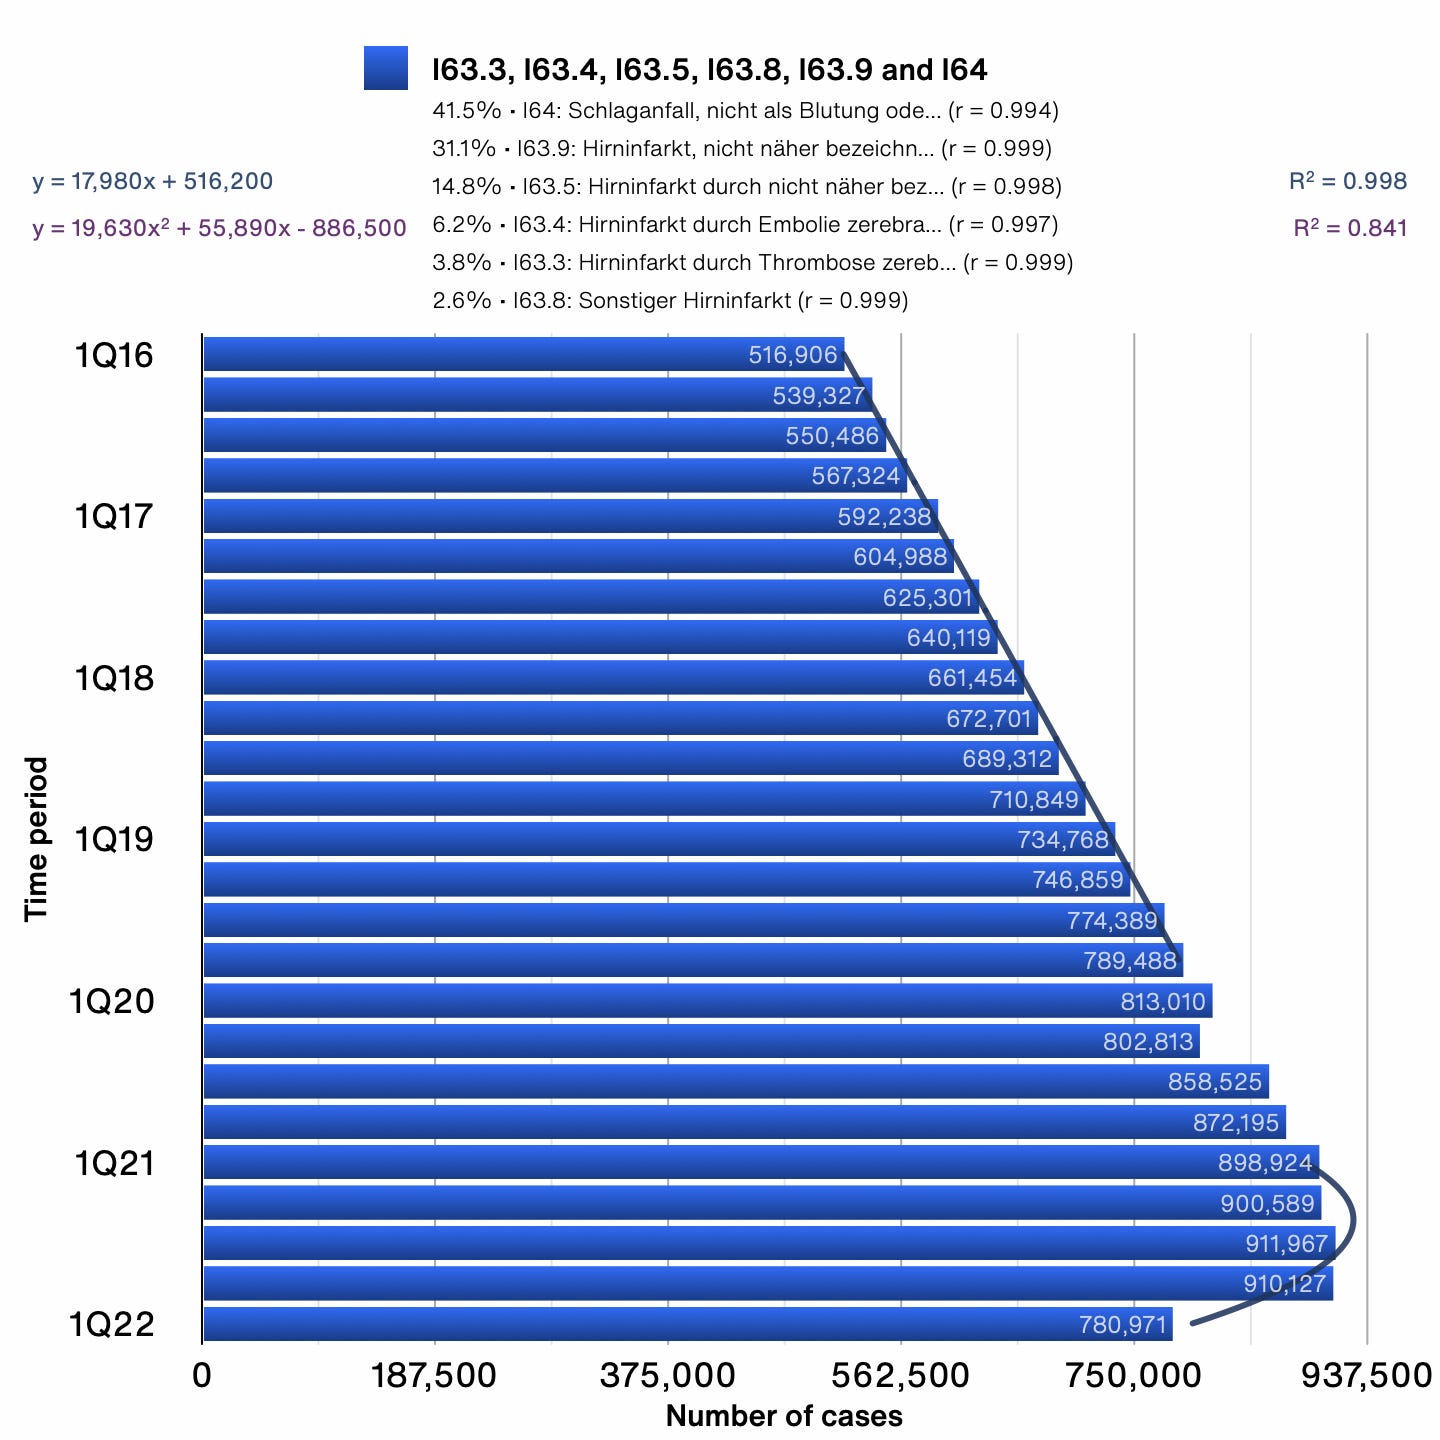
However, there were also unexpected decreases in many conditions such as cancers, heart attacks and strokes, which grew extremely consistently before abruptly plateauing in 2Q21 and dropping off thereafter. Lung cancer, for example, grew exponentially from 1Q16–4Q19 (R^2 = 0.996) while heart attacks and strokes increased linearly (R^2 = 0.996 and 0.998, respectively). In 1Q22, heart attacks and strokes dropped off 13.9% and 14.2%, respectively, compared to the previous quarter, which is significantly greater than the decline caused by lockdowns in 2Q20 (-1.3% and -1.3%).
To determine whether these unusual decreases could be a consequence of proportional decreases in the underlying number of people, I sorted diseases by R^2 (from 1Q16–4Q19) to find diseases with the most predictable trends (most constant, linear and exponential).
Constant
#1 G25.8 Other specified extrapyramidal and movement disorders (stddev/average = 0.0081)
#2 M43.1 Spondylolisthesis (0.0091)
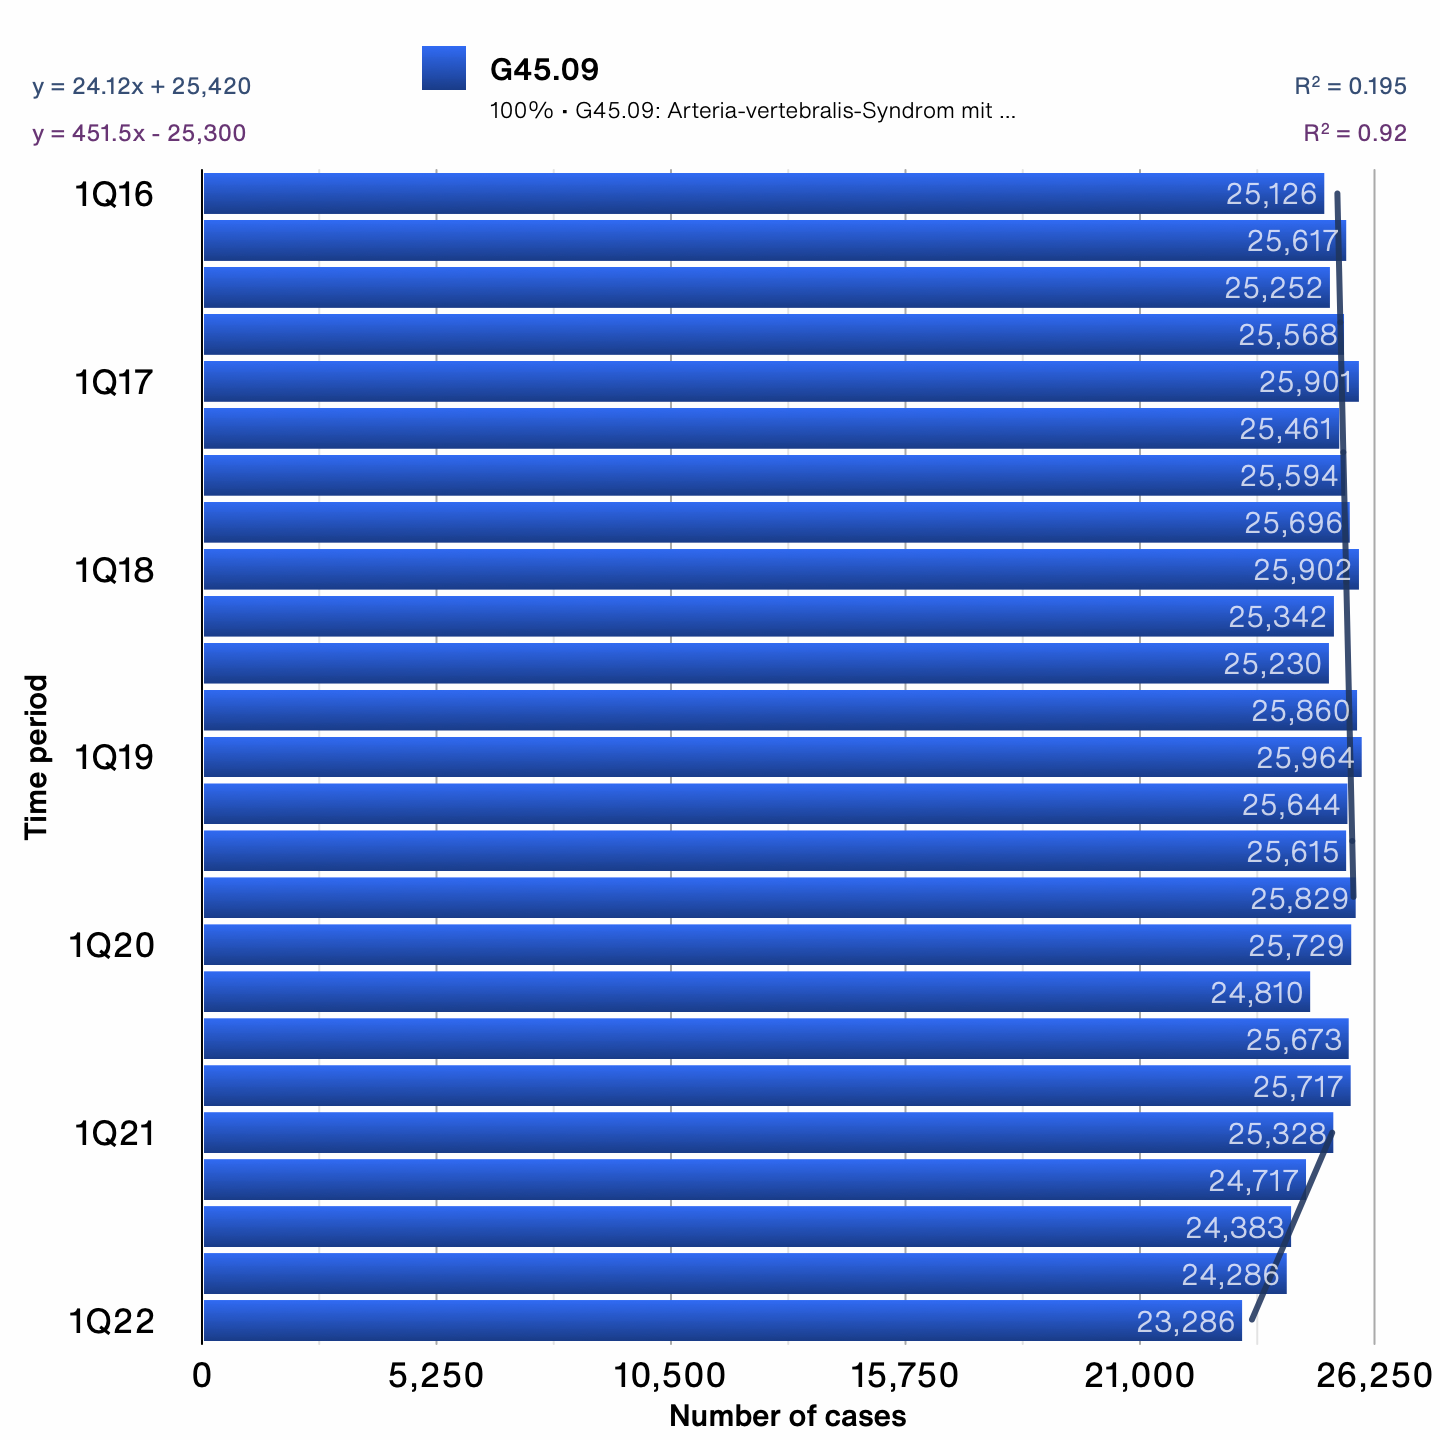
#3 G45.09 Vertebro-basilar artery syndrome Course of remission unspecified (0.0098)
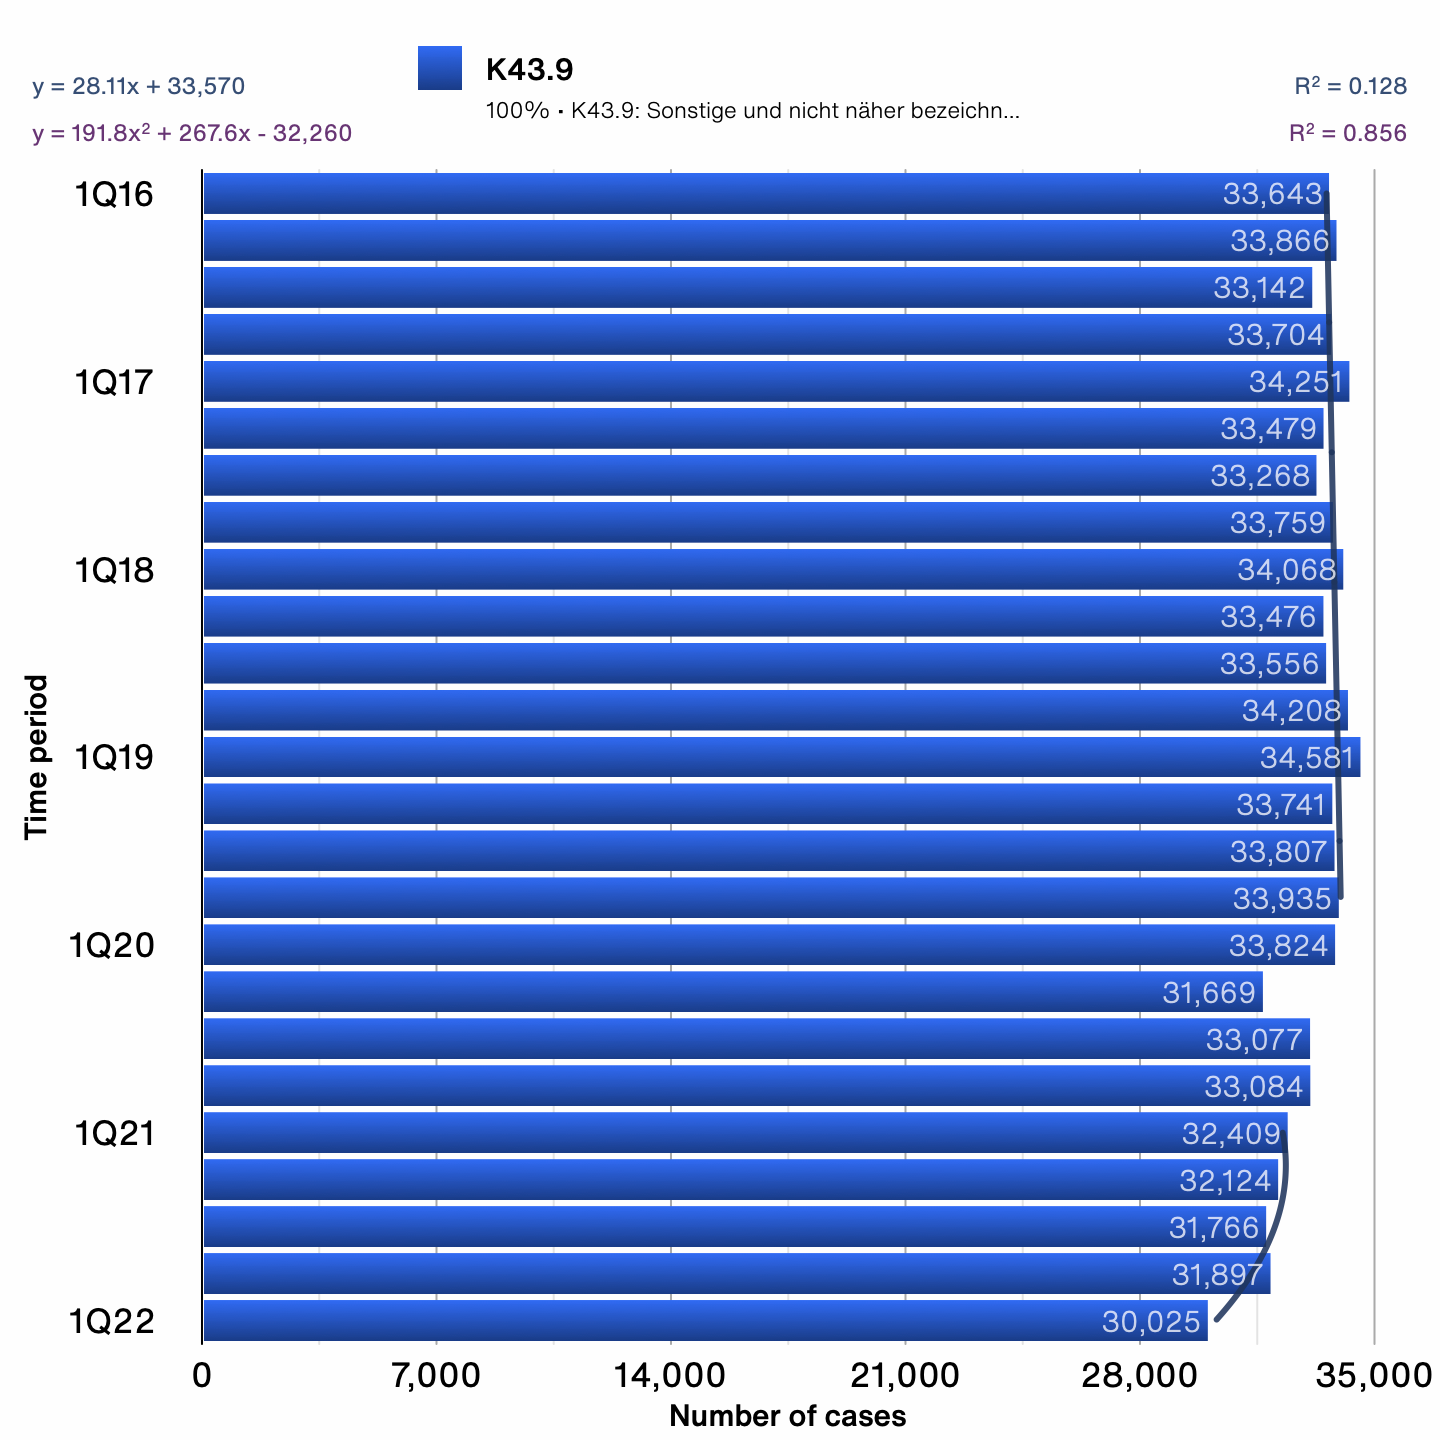
#4 K43.9 Other and unspecified ventral hernia without obstruction or gangrene (0.0107)
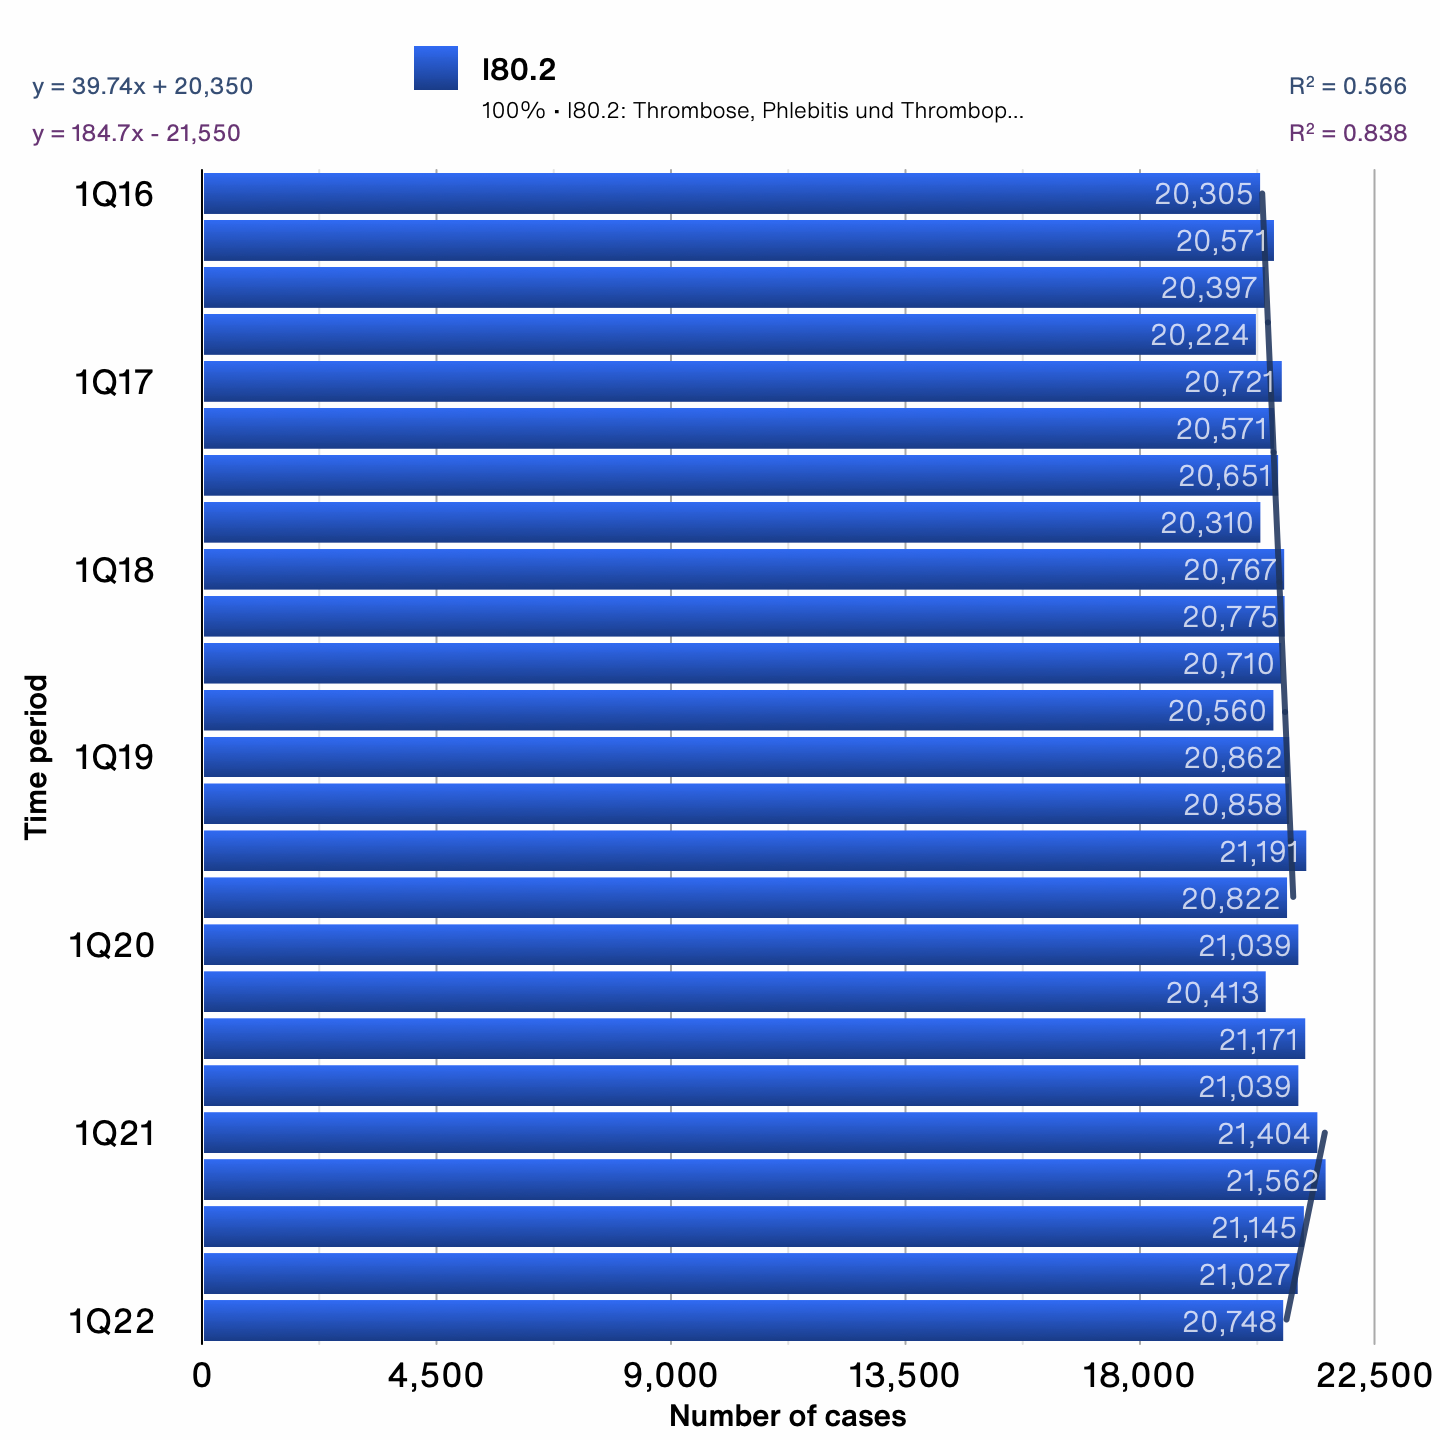
#5 I80.2 Phlebitis and thrombophlebitis of other deep vessels of lower extremities (0.0118)
Linear
#1 Z95.88 Presence of other cardiac and vascular implants and grafts (R^2 = 0.99897)
#2 I61.0 Nontraumatic intracerebral hemorrhage in hemisphere, subcortical (0.99896)
#3 F01.1 Multi-infarct dementia (0.99886)
#4 F01.9 Vascular dementia, unspecified (0.99867)
#5 G20.11 Primary Parkinson disease with moderate to severe impairment With fluctuations (0.9985)
Exponential
#1 G23.1 Progressive supranuclear ophthalmoplegia [Steele-Richardson-Olszewski] (correlation with the curve x^1.5: r = 0.99959)
#2 U50.50 Very severe motor function impairment: Barthel Index score: 0-15 (r = 0.99947)
#3 F05.1 Delirium superimposed on dementia (0.99939)
#4 R26.2 Difficulty in walking, not elsewhere classified (0.99929)
[#5 U50.40 and #6 U51.10 are similar to #2 and were excluded]
#7 G31.82 Lewy body(ies)(dementia)(disease) (0.99911)
[To improve readability, I inserted charts for these diseases at the end of the post.]
Significant decreases starting in 2Q21 are apparent for 4 of the top 5 most constant diseases (most constant from 1Q16–4Q19), with the lone exception potentially being vaccine-related (superficial thrombophlebitis of the penis has been reported after AstraZeneca/ChAdOx1-S). Similarly, all 5 of the 5 most linearly growing diseases either plateau or begin declining in 2Q21, and 4 of the 5 most exponentially growing diseases also break trend in 2Q21, the exception being R26.2 (difficulty in walking) which isn’t obviously associated with, but may still be related to COVID-19 vaccines. In summary, 13 of the 15 diseases broke trend in 2Q21 (but not in 2Q20), with the two exceptions being potentially vaccine-related.
Finally, to determine the size of the decline in 2021, I filtered diseases with exceptionally high R^2 values (using different thresholds) and calculated the average deviation from trend for each quarter since 2019. For example (one line corresponds to one disease):
[0.998] Avg deviation from trend in 1Q016-4Q19: -0.0000272, 2021-1Q22: -0.0675
[0.997] Avg deviation from trend in 1Q016-4Q19: 0.000044, 2021-1Q22: -0.0795
[0.998] Avg deviation from trend in 1Q016-4Q19: -0.0000522, 2021-1Q22: -0.105
[0.996] Avg deviation from trend in 1Q016-4Q19: -0.0000918, 2021-1Q22: -0.0847
[0.996] Avg deviation from trend in 1Q016-4Q19: -0.0000738, 2021-1Q22: -0.14
…
The results are as follows:
The results show that the decline accelerates in 3Q21, becoming greater than almost all previous declines, and the size of the decline in 1Q22 is somewhere between 6.81% and 9.67% depending on the cutoff used.
Since we want to determine the size of the decline, I decided to do the same calculation again, this time excluding diseases whose actual value for 2Q21 was greater than the expected value, since these diseases might be confounded by the COVID-19 vaccines (I’m not sure whether this is a valid approach).
Interestingly, these results are very consistent irrespective of the cutoff used, with an effect size between 12.08% and 12.74%. In conclusion, around 7–13% less cases than expected (based on trends from 2016–2019) were recorded in 1Q22 for the most predictable diseases. Something to keep in mind is that many of the included diseases primarily affect older people. In the US, 16.9% of the population is 65 or older, and a 10% decline in this age group would amount to just a 1.7% decline in the general population. Nonetheless, a 1.2–2.2% decrease in the overall population would still be difficult to conceal in statistics, and such a decline should have raised major red flags. Therefore I’m having a hard time understanding how such a large decline could be apparent in this dataset, but not in population statistics or other datasets.
If you have any ideas to explain the data, or feedback about the post, please leave a comment below.
[The following are charts for the 15 most predictable diseases I identified]









Hello! I revised the article and embedded your post in it.
I explained what the code and nocode thing meant; I had to translate the original FOIA to figure it out.
Could the decline in 2022 be as a result of the Dry Tinder theory. In other words, those extra numbers died out in 2021.